

California wants less plastic. The first ISR plans show how brands are getting there.
California's packaging law, SB 54, sets a big goal: by 2032, producers in California should use 25% less single-use plastic packaging than it did in 2023. That target is shared across all producers in the program and tracked through Circular Action Alliance (CAA), the organization running California’s EPR program. A single brand is not required to individually achieve 25% on its own, but every brand's cuts count toward it. And the goal isn't recycling more. It's using less. That's what "source reduction" means: cutting plastic at the source, before it ever reaches a shelf.
This year, brands got their first real test. They began submitting Individual Source Reduction (ISR) plans to CAA, spelling out exactly how they'd make reductions. rePurpose helped prepare and file a batch of those plans in August 2026. That gives us an inside look few others have: the actual plans brands filed, not survey answers. We dug into each one and looked across them as a set to surface patterns any brand can learn from: who found savings, where they found them, and what still stands in the way.
This year's plans are only the first chapter. Source reduction will continue to evolve. As California's program matures and the fees and incentives shift, the smartest packaging moves will shift too. Keeping up on your own gets harder every year.
That's where rePurpose comes in. Our platform keeps your reduction plan current, updating automatically every time your packaging changes, so you're not rebuilding the math from scratch. And because we work with many brands, every plan we help file makes the picture sharper for all of them: which parts carry the most plastic, which moves pay off, and what's actually working. You get the advantage of insights drawn from collective data, applied to your own products and packaging.
The findings below are a first look at what California’s ISR Plans actually show.
The short version: what the plans show, and what to do
In the ISR plans rePurpose filed, here's what we found:
- Most brands found plastic to cut. About 7 in 10 had real, measurable changes ready.
What to do: Start now. Reductions compound. - A few smart changes did the heavy lifting. The best results came from changing a handful of parts, not every product.
What to do: Target common closures, liners and films first. - The biggest savings come from the slowest fix. Swapping plastic for a different material resulted in much more significant reductions, but it takes the longest to pull off.
What to do: Begin supplier talks now. - Growth is the real challenge. The law counts total plastic. When you sell more products, you have more plastic to reduce.
What to do: Model your growth against your 2023 baseline.
1. Most brands are doing real reduction work, and the impact is scaling
CAA asked for realistic source reduction projections, and brands were free to say no reduction was possible. Yet about 70% of the brands we worked with found genuine source reduction: specific packages and changes, with the plastic savings measured. Using the rePurpose Packaging Simulator, they modeled each packaging change with weight attached and saw the impact on their reductions instantly, both now and in the years ahead.
And those reductions compound. Measured against the 2023 baseline, reduction activity triples over the compliance period: about 6% of baseline in 2026, 11% by 2029 and 19% by 2031.
That climb comes from the maturity of packaging changes. For instance, an entire package redesign could be completed by 2029, whereas finding and onboarding a new packaging supplier could take longer, toward the end of the program. As these changes mature, the reductions stack up.
And the payoff goes beyond compliance. Reducing packaging now pays more: the newly released source reduction fee credits and penalties (otherwise known as bonus and malus) incentivizes reducing packaging, and the main source reduction bonus more than doubled, to $500 per ton.
In addition, EPR fees are largely based on packaging weight, so cutting plastic will generally lower what you pay. When we applied the final 2027 EPR fees to our customers' packaging data, plastic parts stood out:
- Small plastic parts cost more. In our analysis, rates for caps, lids and pumps 2 inches or smaller rose 27% in Colorado and went up in Oregon, while many other materials rose only slightly or got cheaper.
- More plastic pieces mean a bigger January bill. Part of California's fee is charged per plastic component and billed entirely in January. Three out of ten customers with high component counts saw 80% to 82% of their annual California fees on that first invoice.
So depending on your packaging mix, the same changes that count toward your ISR plan, especially fewer or lighter plastic parts, may also help lower your EPR fees. And as fees and eco-modulation rules shift, less plastic will likely mean less exposure to whatever comes next. See what 2027 EPR fees revealed across real brand portfolios.
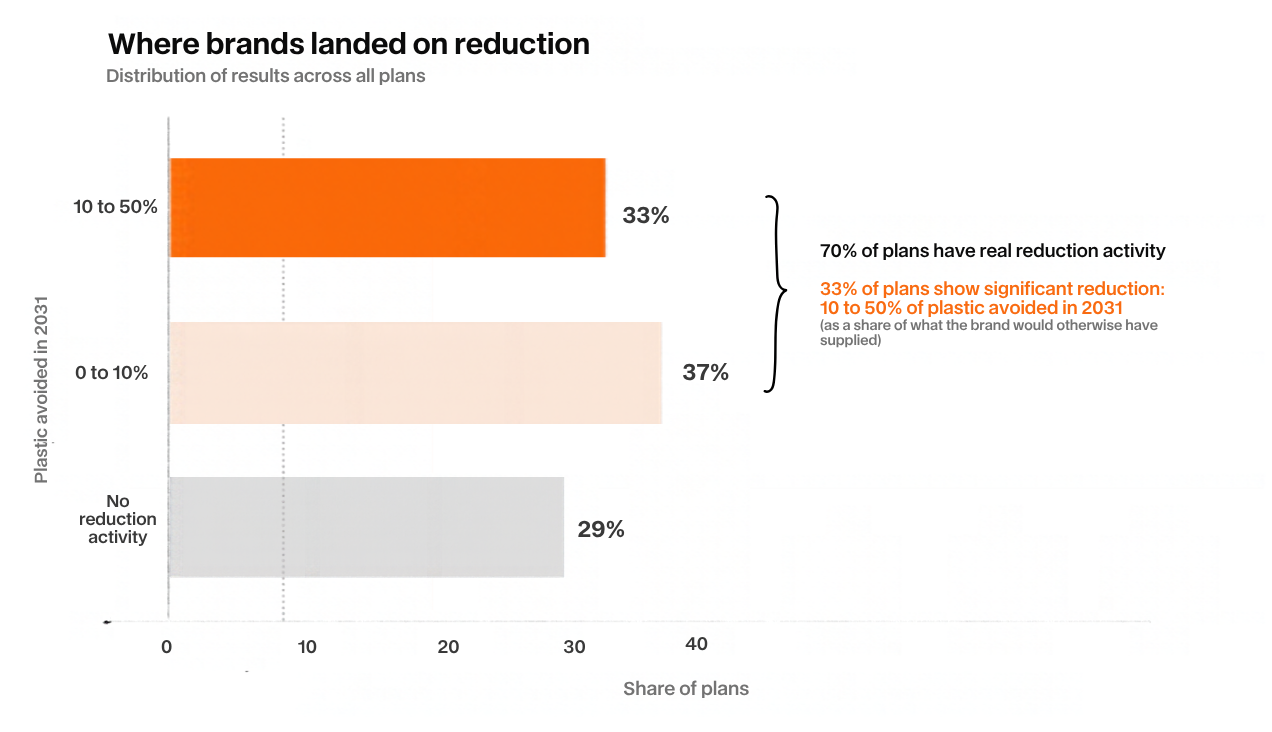
One important note: these figures reflect packaging changes alone. They don't account for sales growth, and ISR guidelines require brands to cut plastic net of any growth over this period. That's where the real challenge lies. More on that in Finding 4.
The takeaway: Start now. Reductions compound, so a change made this year keeps paying off every year after. The sooner a redesign or supplier switch is underway, the more it adds up by 2031.
2. The best reduction results came from changing a small, well-chosen set of components
This may be the finding that most affects how you plan for packaging redesign: the size of your portfolio isn’t the size of your problem. In other words, a big portfolio doesn’t have to mean a big redesign.
Across every plan with SKU-level data, here’s what we found. Imagine a brand with 100 products. The typical brand in our set changed about 14 of them and cut about 10% of its plastic. The best performers changed about 16 products, nearly the same number, and cut roughly 42%.
Same effort. Four times the result.
A look at the results by quartile shows the pattern: changing more SKUs doesn't correlate with reducing more plastic.
The difference was which products they picked. The leaders looked for where plastic was concentrated. Often it was a single closure, liner, or film used across dozens of products. Change that one part, and every product using it gets lighter at once.
Finding that part is where the rePurpose Packaging Simulator can help. It combs through every component in your portfolio and shows which ones carry the most plastic, so you can see where a single change goes furthest. Book a demo to see it on your own packaging.
The takeaways:
- Rank the portfolio by weight contribution before anything else. The bestselling SKU is not always the heaviest plastic contributor. The leading plans found a small cluster of formats carrying a disproportionate share of plastic.
- Work at the component level, not the product level. One closure or film spanning dozens of SKUs is a single design decision with portfolio-wide reach, and it moves the component metric as well as the weight metric.
3. The most effective brands are using the source reduction pathways strategically
There are a few ways to cut plastic. The brands in our plans leaned on three:
Brands reached for the fastest lever first: elimination. That makes sense since the biggest catch is time.
The pathways mature predictably. The reduction impact of elimination leads early because SKU rationalization (in other words, discontinuing a product) is fast. Right-sizing can occur mid-period (~2029, between 2023 baseline and 2032 goal year) as design cycles finish. A material switch means finding and testing a new supplier, which can take several quarters. That’s why, in these plans, the reduction impact of material switching scales toward 2031.
But one of the least-used pathways is the highest-yielding one. Brands that led with material switch opened up the smallest share of their portfolio and got the most from it, by a wide margin. This highest-leverage lever is also the one that takes the longest, so it’s important for brands to begin those supplier conversations early.
For every product changed, a material switch cut about 23 times as much plastic as right-sizing. Brands that led with it changed just 6 in 100 products and still cut 28% of their plastic.
Most effective, per unit of effort. Indexed to right-sizing = 1x, by median plastic avoided per SKU changed:
The takeaway: Start the slow, high-impact pathway first. Have the supplier conversation now, not in 2030.
4. The twist: the more your sales grow, the harder it gets
This is the tricky part. California's target isn't about plastic per product. It's about total plastic, compared with what you used in 2023. In the plans we’ve helped prepare and file, we find that the packaging work is nearly sufficient to hit the reduction target. However, once you factor in brands’ sales growth projections, that target becomes much more challenging to achieve.
An absolute target measured against a fixed 2023 baseline is indifferent to how efficient your packaging becomes. A brand that halves plastic per unit and triples unit sales still uses 50% more plastic than it did in 2023, falling short of the target.
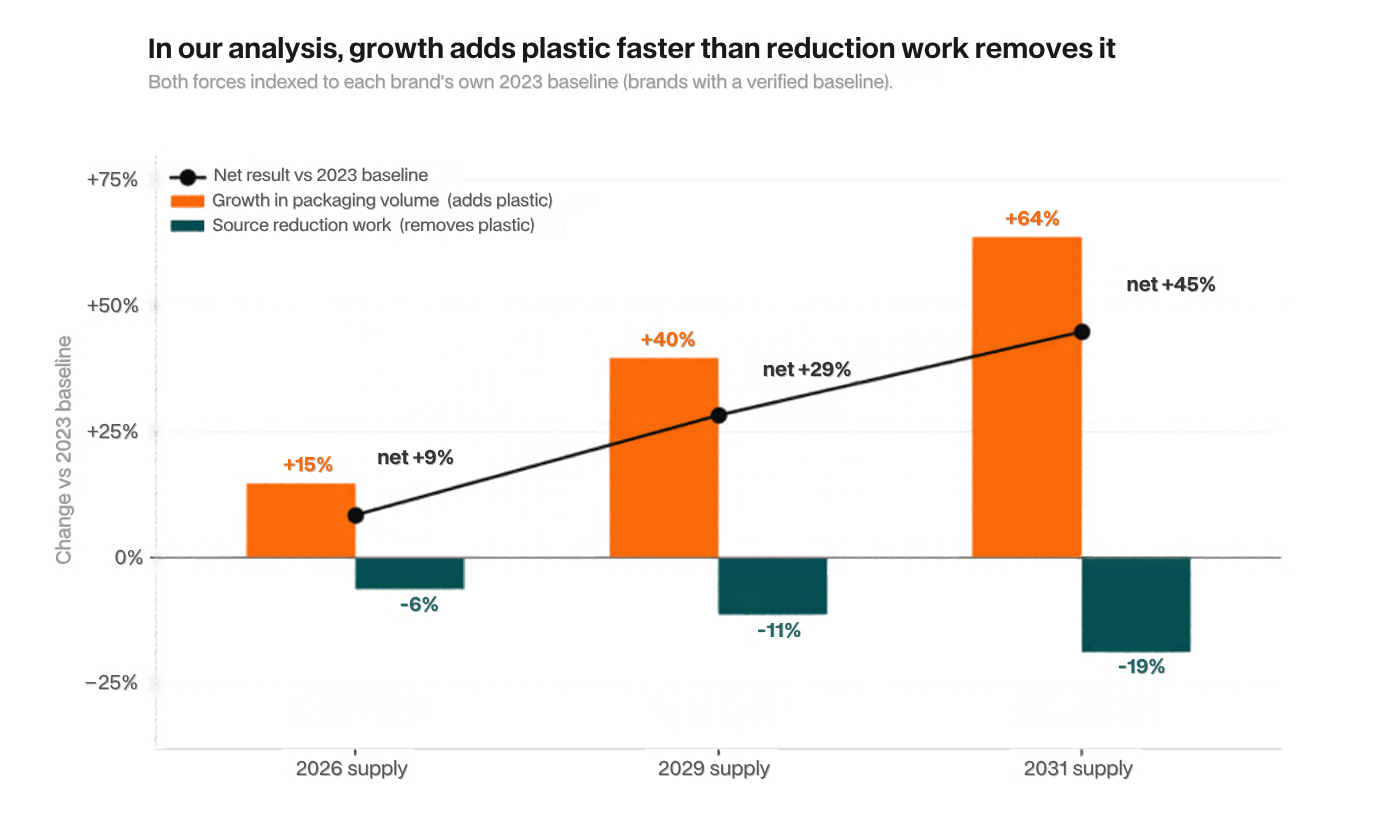
So the brands with the most momentum, growing fast and eager to improve, often face the steepest climb. But they’re not alone. Every brand in California’s EPR program is working toward the same goal, and every step forward helps make the climb easier for the rest.
The takeaway: Don't let the math discourage you. California's target is shared, so every pound you cut counts toward the statewide goal, even if growth means you can't hit 25% on your own. And the work pays off for your brand, too. Reductions compound, so every cut keeps counting year after year. California’s source reduction bonus has more than doubled, giving you credit of $500 per ton. And less plastic will often result in lower EPR fees.
Even your growth can be part of the solution. Every new product is a chance to design lighter from the start, before the packaging is locked in and changes get expensive. Model your changes and your new launches in the rePurpose Packaging Simulator, so every packaging decision moves you, and everyone, further.
What to do next
You don't need a portfolio-wide redesign. You need to know which slice of your portfolio to open up, and how your growth changes the target.
- Rank by weight contribution. Find the components (units × plastic per unit) carrying an outsized share of your plastic footprint.
- Look for shared components. A closure, liner or film across many SKUs is one decision with portfolio-wide reach.
- Open the supplier conversation now. Material switch delivers the most and takes the longest. Start supplier qualification before lead times catch you.
- Model your growth against the baseline. Know how to calculate your net gap.
See where your portfolio stands. rePurpose Global's Packaging Simulator models reduction scenarios and growth against your 2023 baseline, so you know your gap and your best levers.
- Haven't filed an ISR plan yet? Talk to our team about getting started.
- Already filed this year? Book a demo and turn this year's plan into a smarter strategy for the years ahead.
About the data
Findings come from the ISR plans rePurpose prepared and filed with CAA in August 2026. Pathway and SKU findings use plans with SKU-level tagging. The set is directionally representative of mid-market, high-growth consumer brands.
Related posts


.avif)
.jpg)